

2 min read
Fall 2025 signaled more than just cooler weather and changing leaves in Canada—it ushered in one of the most dynamic periods for television and video consumption. This season was especially electrifying as the Toronto Blue Jays chased playoff glory, drawing millions of viewers and uniting fans from coast-to-coast around their screens. Major national events like the Grey Cup further rallied audiences, making linear TV a central hub for live sports and communal experiences. Check out our insights on the World Series and Grey Cup here.
Canadians found themselves in a rapidly evolving media landscape, where traditional TV content and major sports events contended with high profile streaming releases for audience attention. In this shifting environment, Numeris’ National VAM delivers unparalleled insights into how audiences engage with both linear and streaming content. Fall 2025 viewing habits revealed powerful—and sometimes surprising—differences by age, region, and device, offering meaningful guidance on where attention truly lived.
Linear vs Streaming: Evolving Trends
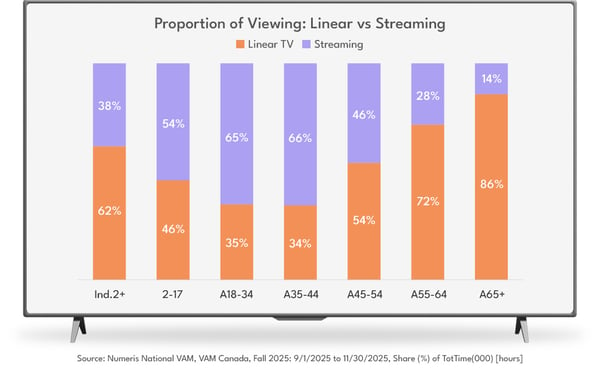
Nationally, Canadians 2+ lean toward linear viewing, with 62% of total video consumption occurring on traditional television, compared to 38% via streaming. But as we dig deeper into the data, we can see some differences by age and region.
-
Younger Adults (18–44) are the most streaming dominant demographic, dedicating 65% of their video time to streaming platforms.
-
Those 45+ spend most of their viewing time with linear TV.
Regional and Market Differences
-
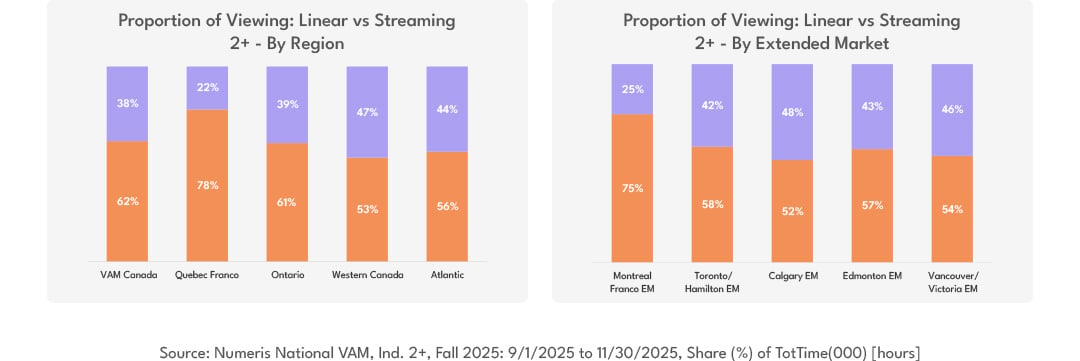
Quebec Franco stands out with 78% linear viewing - the strongest in the country.
-
Western Canada is the opposite leading streaming consumption at 47%.
-
In extended markets, Calgary EM is more evenly split between linear and streaming while Montreal Franco EM remains deeply linear at 75%.
Weekly Viewing Hours: Volume Tells a Different Story
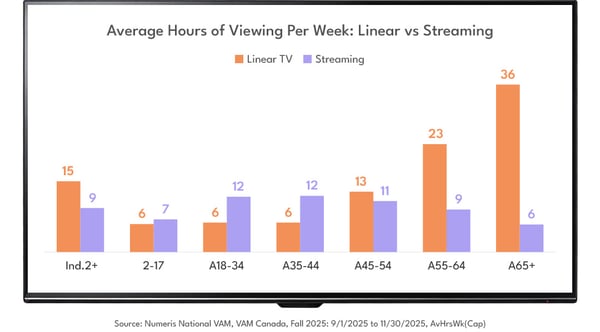
While proportion shows preference, hours tuned per capita reveal who drives actual viewing volume, demonstrating different patterns between older and younger viewers.
Different Regions, Different Behaviours
-
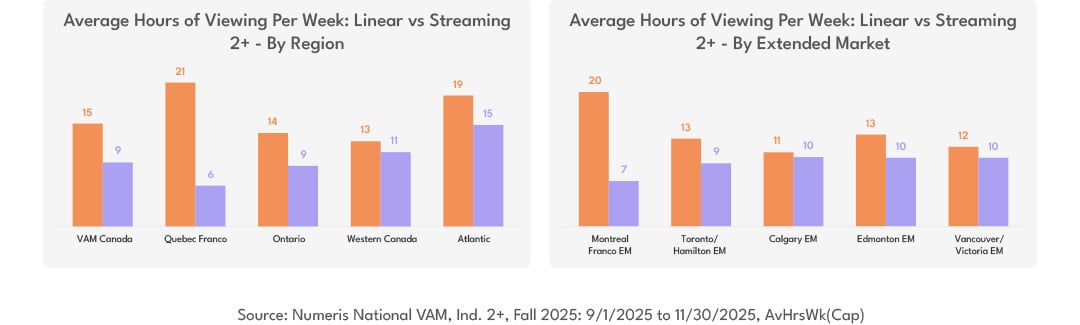
Quebec Franco leads linear hours with 21 per week for Canadians 2+ while the Atlantic region leads streaming with 15 hours weekly.
-
In extended markets, Western cities of Calgary, Edmonton and Vancouver claim the highest weekly streaming volume at 10 hours per week.
Devices: Television Still Reigns Supreme
Despite growth in mobile and on the go viewing, the television set (Linear + Smart/Connected TV) remains the #1 video device, accounting for 79% of all video time among Canadians 2+.
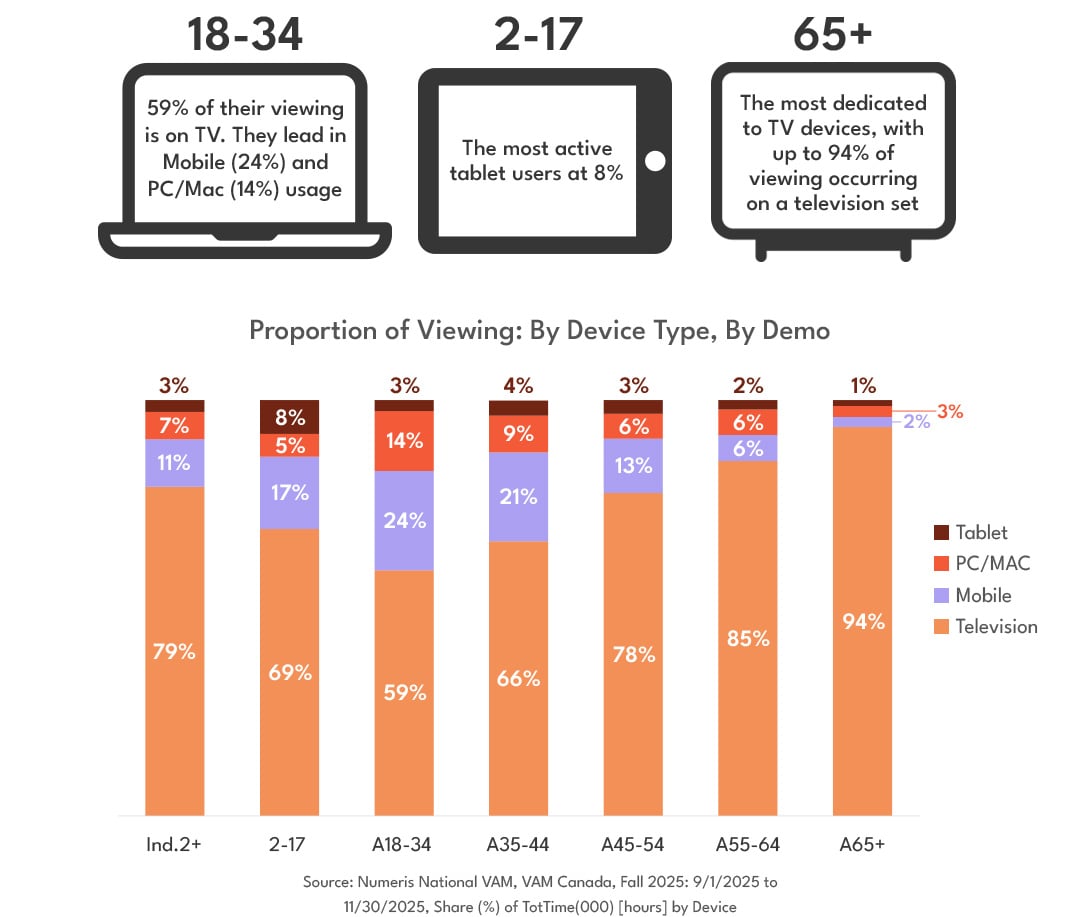
 One key finding emerges from our Fall viewing analysis: Canada’s video ecosystem is diverse and highly segmented. This diversity is reflected in audience behaviours by age, regional and cultural nuances, preferred devices for viewing, and the need for platform-specific audience targeting strategies.
National VAM data is the key to unlocking the most complete and detailed view of Canada’s video landscape. With viewers spread across different screens, age groups, and regions, only National VAM can bring all the important pieces together. It helps broadcasters, advertisers, and publishers see how Canadians really watch video, whether on TV, tablet, linear or streaming. With this big-picture insight, National VAM can help you make smarter choices and connect with audiences in the ways that matter most.